
With Friday’s fall, both the Dow Jones and the S&P 500 have entered a “technical correction”, meaning a 10% or more fall from the peak. The Nasdaq, ha…

 1/10
US markets had a brutal day on Friday amidst intense selling pressure as the AI trade continued to unwind. The Dow Jones fell another 950 points, taking the drop for the week to 4,100 points. The S&P 500 fell 3.7% on Friday, while the Nasdaq indices – Composite and 100, fell over 5.5% each.
 2/10
The Nasdaq 100 fell 5.6% on Friday, capping its worst week since March 2020. At its intraday low, the index had slumped more than 20% from its recent record high, meaning it had momentarily slumped into a “bear market”. For the Dow, it was also the worst week since March 2020 with a 8% drop, while the S&P 500 had its worst weekly performance since April 2025.
 3/10
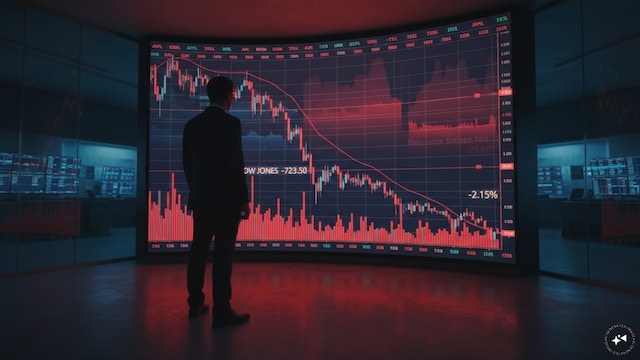
With Friday’s fall, both the Dow Jones and the S&P 500 have entered a “technical correction”, meaning a 10% or more fall from the peak. The Nasdaq, has reversed all the gains for the year, and has now turned negative on a year-to-date basis.
 4/10
Chipmaker and software stocks continued to remain the worst hit on Friday. Nvidia shares fell 14% on Friday. AMD, which fell 8% on Thursday after the short-seller report, fell another 13% the next day. Neoclouds like CoreWeave and Nebius Group fell 12% and 16% respectively, while Micron, Sandisk and Western Digital, the high-flyers of the year on the S&P 500, fell between 12% and 16% on Friday.

(Photo Credit : An NVIDIA logo appears in this illustration taken August 25, 2025. (Reuters photo))
5/10Nvidia’s troubles just don’t seem to end. The stock fell 22% this week, the seventh straight weekly loss reported by the company. The last instance the stock fell for seven straight weeks? During the global financial crisis of 2008. Reuters reported that the US Securities & Exchanges Commission is exploring possible accounting issues at the company.

(Photo Credit : Bloomberg)
6/10Anthropic, the biggest IPO of the world on record, had a dream debut on Thursday, listing at a 34% premium to its issue price of $83. However, the sell-off trimmed those gains to 17% on listing day, and knocked off another 8.5% on Friday, taking the stock back to nearly the same as its issue price, closing at $88.91.
 7/10
Gold prices also continued to slide for the fifth day running, marking their biggest weekly fall since March this year. Fears of the US Federal Reserve aggressively hiking rates to combat inflation, along with a rout in AI stocks, is causing this widespread sell-off, not just in gold, but in other precious and industrial metals as well. Gold is now down 9% for the week, fell to its lowest levels since September 2025, and is decisively below the $4,000 an ounce mark, which many investors felt could be a floor for the fall. Silver is down 15% for the week.
 8/10
The sell-off in AI stocks has spurred demand for haven assets. The US 10-year yield fell below the 5% mark again on Friday, sliding to 4.95%, while the Yen and the Swiss Franc strengthened against the US Dollar. The Yen gained 0.7% against the greenback, while the Franc snapped an eight-day losing streak. That has prevented the US Dollar index from breaking past the mark of 104, which it currently finds itself near.
 9/10
While the high-beta names sold-off sharply overnight, investors chose to find some shelter in traditional, old-economy defensive names. Shares of Walmart, Costco, Johnson & Johnson, and Procter & Gamble saw shares gain between 1% to 1.5% overnight, but that could not prevent the 30-stock Dow Jones from falling another 950 points on Friday.
 10/10
Is the sell-off done? A top technical analyst in the US said NO. Jonathan Krinsky, appearing on CNBC on Friday said that the technical setup doesn’t point to the fact that the sell-off is over. He cited Apple, currently the most valuable company in the world, which is only down 3% to 4% from its highs, stating that whenever the S&P 500 has dropped 8% or more from its peak, by the time it makes its final bottom, the average drawdown in Apple has been 23%! He also added that more than 50% of S&P 500 stocks are still above their 50-Day Moving Average, compared to a number below 40% or even 20% when the S&P 500 forms a durable bottom.