
Over the past 26 years, Indian equities have weathered six major shocks — from the dot-com bust and the 2008 global financial crisis to the Eurozone d…
 1/13
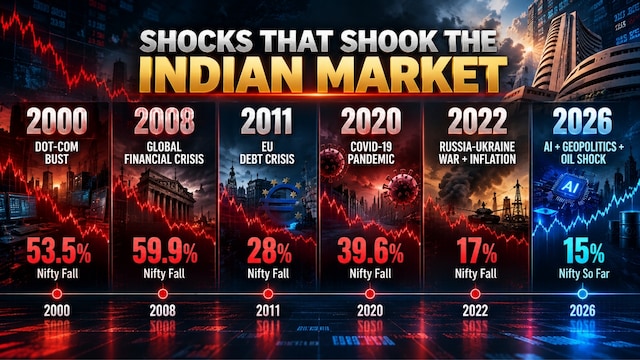
1/13Over the past 26 years, Indian equities have weathered six major shocks — from the dot-com bust and the 2008 global financial crisis to the Eurozone debt crisis, COVID-19, the Russia-Ukraine conflict and the latest oil-and-bond shock. Each episode had a different trigger, transmission channel and impact on markets.
 2/13
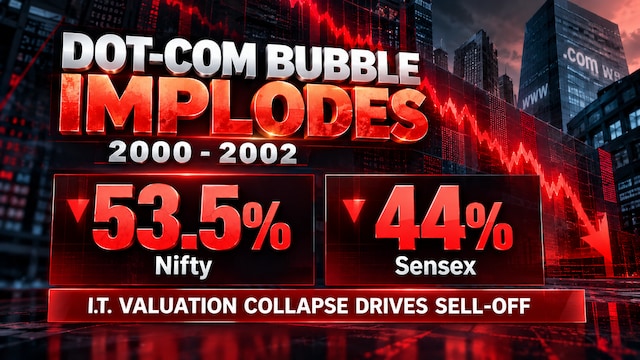
2/13The dot-com bust hits Indian equities | The bursting of the technology bubble triggered a sharp reassessment of valuations globally. The Nifty plunged 53.5%, while the Sensex fell around 44% from its peak, as the collapse in technology valuations spilt into Indian IT and new-economy stocks.
 3/13
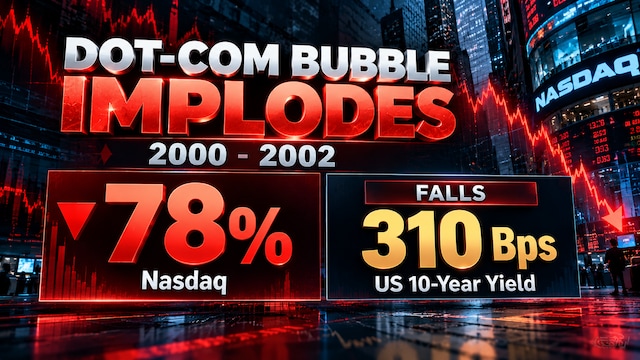
3/13The global tech bubble collapses | The shock was led by the US technology sector, with the Nasdaq plunging nearly 78% from peak to trough. As investors moved away from risk, the US 10-year Treasury yield fell by around 310 basis points. Unlike 2008, this was primarily a valuation and technology-led crisis, not a banking crisis.
 4/13
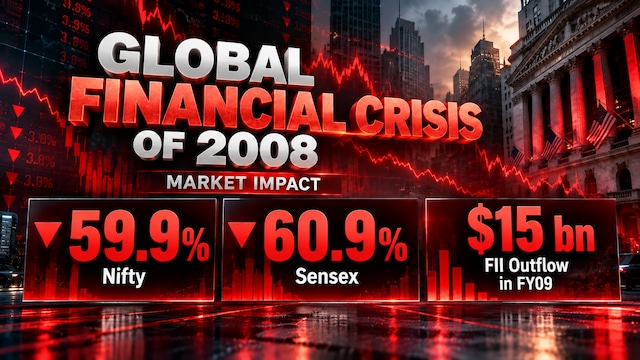
4/132008: When the financial system came under stress | The collapse of Lehman Brothers and the freezing of global credit markets triggered an unprecedented risk-off wave. The Nifty crashed 59.9%, while the Sensex fell 60.9%. Foreign investors pulled roughly $15 billion from Indian equities in FY09, adding to the pressure on domestic markets.
 5/13
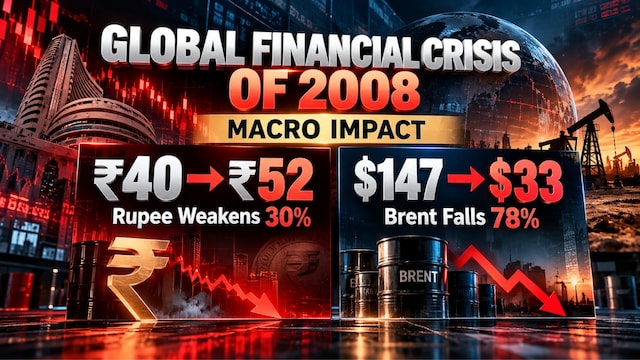
5/13The crisis hits the rupee and crude | The global financial crisis also had a sharp impact on India’s currency and commodity markets. The rupee weakened from around ₹40 to ₹52 per dollar, while Brent crude collapsed 78%, falling from nearly $147 to $33 a barrel.
 6/13
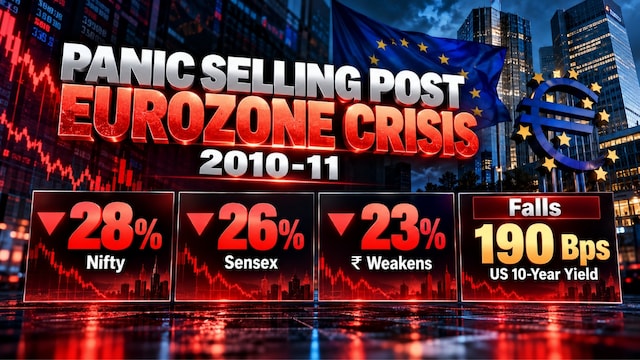
6/13Another global shock hits India in 2010-11 | The Eurozone sovereign debt crisis brought fresh fears of sovereign defaults, banking stress and another global recession. The Nifty fell around 28% and the Sensex about 26%, while the rupee weakened 23%. For India, the key transmission channel was global risk aversion rather than a domestic banking crisis.
 7/13
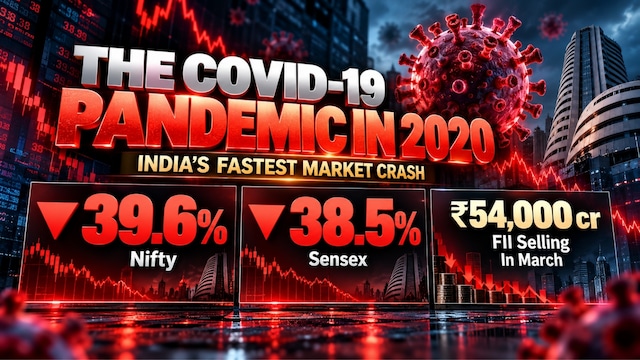
7/132020 delivered India’s fastest market crash | COVID-19 triggered one of the sharpest and fastest sell-offs in Indian market history. The Nifty plunged 39.6% and the Sensex 38.5%, with the Nifty losing nearly 40% in just over two months. Foreign investors sold around ₹54,000 crore of Indian equities in March alone.
 8/13
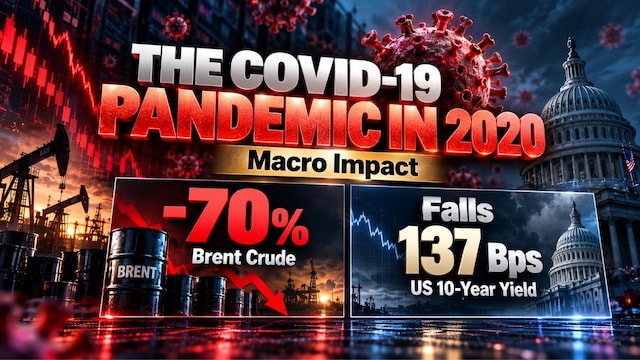
8/13COVID sends crude and bond yields lower | The pandemic shock was accompanied by a collapse in global demand and a flight to safety. Brent crude fell around 70%, while the US 10-year Treasury yield dropped around 137 basis points as markets priced in a global recession and an aggressive policy response.
 9/13
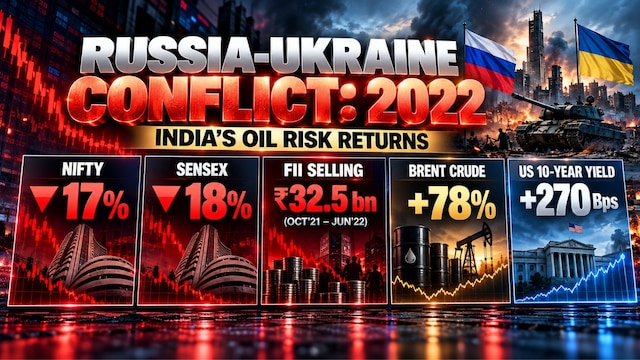
9/132022 brings India’s oil vulnerability back into focus | Russia’s invasion of Ukraine sent commodity prices sharply higher, putting India’s dependence on imported energy back in focus. The Nifty corrected around 17%, while the Sensex fell approximately 18%. Brent surged 78%, and foreign investors sold around $32.5 billion of Indian equities between October 2021 and June 2022.
 10/13
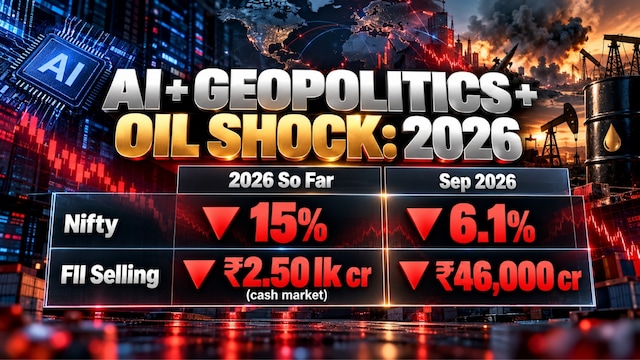
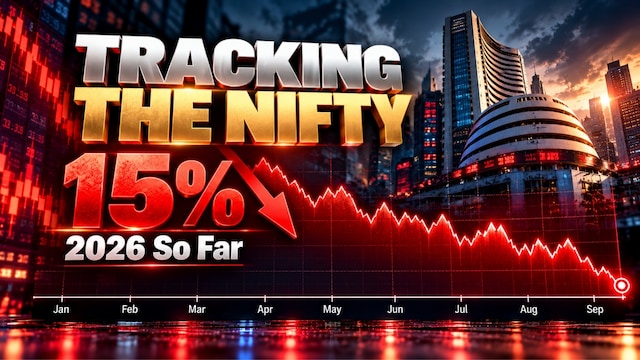
10/132026: Oil, bonds and foreign selling pile on the pressure | The latest shock combines geopolitical tensions, elevated crude prices, rising US Treasury yields, a weaker rupee and heavy foreign selling. The Nifty is down 15% in 2026, with September alone accounting for a 6.1% fall. FIIs have sold around ₹2.5 lakh crore in the cash market so far this year, including nearly ₹46,000 crore in September.
 11/13
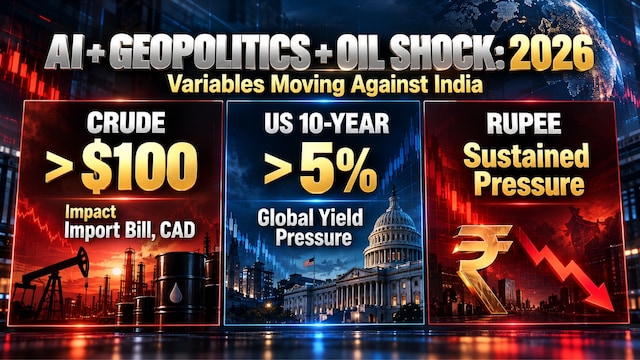
11/13Three variables are moving against India | India is facing simultaneous pressure from oil, US bond yields and the rupee. Brent crude has moved above $100 a barrel, raising concerns over the import bill, inflation and the current account. The US 10-year yield has climbed above 5%, while the rupee has weakened around 6.5% year-to-date.
 12/13
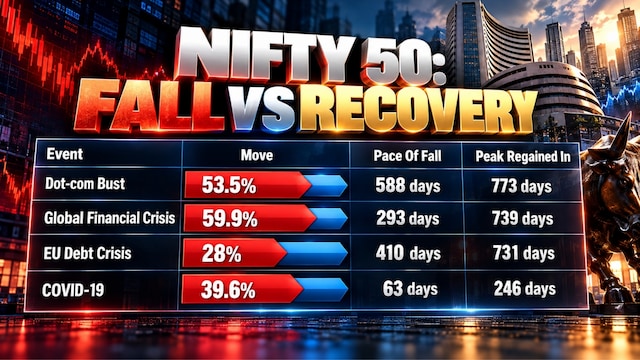
12/13Markets fall faster than they recover | The history of major market shocks shows that sharp declines can take considerably longer to recover. The COVID-19 crash was the fastest, with the Nifty falling 39.6% in just 63 days and regaining its previous peak in 246 days. By comparison, the dot-com bust took 588 days to fall and 773 days to recover, while the 2008 crisis took 293 days to fall and 739 days to regain the peak.
 13/13
13/13How deep will the 2026 correction go? | The Nifty is down 15% so far in 2026, but the eventual market trajectory will depend heavily on how geopolitical tensions evolve. The key question now is whether the current correction deepens further or markets begin to recover.