
Every year, a child who stays in school through Class 12 rather than dropping out at 14 usually has one adult to thank for it more than any policy document: a teacher who noticed, who followed up, who made the difference between a student staying enrolled and quietly disappearing from the rolls. The Unified District Information System for Education Plus (UDISE+) 2025-26 report, released this month by the Union Ministry of Education, is built around that basic unit of the school system. It tracks how many teachers India has, how they’re distributed, and what that distribution means for millions of students. The numbers show a workforce that has grown steadily even as the system around it has become leaner and retained more students.More teachers, lower ratiosIndia’s teacher count rose from 94,83,294 in 2022-23 to 98,07,600 in 2023-24, then to 1,01,22,420 in 2024-25 and 1,02,73,020 in 2025-26, an increase of 8.3% over four years, crossing the one-crore mark along the way. That growth is most evident in the Pupil-Teacher Ratio (PTR), which measures how many students each teacher is responsible for. At the Foundational level, the PTR now stands at 10 students per teacher, down from 11 in 2022-23. Preparatory has moved to 12 from 14, Middle school to 17 from 18, and Secondary to 21 from 23. All four levels are now well within the 30:1 ratio recommended under the National Education Policy; a lower PTR generally means more attention per student and classrooms that are easier to manage. The improvement has been gradual rather than sudden: Preparatory PTR, for instance, moved from 14 to 13 to 13 before settling at 12, showing the kind of steady year-on-year correction that comes from sustained recruitment rather than a one-time push.Dropout and retention figures follow the same broad trend, though not evenly across every level. Preparatory dropout fell from 8.7% in 2022-23 to 3.7%, then 2.3%, and now 1.8% in 2025-26, a decline of nearly 7 percentage points in four years. Secondary dropout came down from 13.8% to 7.0% over the same period, nearly halving. Middle school is the exception: after falling steadily from 8.1% to 5.2% to 3.5% across three years, its dropout rate ticked up slightly this year, from 3.5% to 3.6%, the only level where the four-year trend reversed rather than held.Retention tells a similar mixed story. Secondary retention jumped from 47.2% to 51.9%, helped by more schools now offering secondary education, and Middle retention rose from 82.8% to 83.7%, continuing a climb from 75.8% in 2022-23. Foundational retention eased this year, from 98.9% to 98.5%, after three straight years of gains from 92.1% in 2022-23. Preparatory retention also slipped, from 92.4% to 91.1% — but unlike Foundational, its four-year path wasn’t a steady climb: it fell to 85.4% in 2023-24 before recovering to 92.4% the year after, and now sits only marginally above where it started in 2022-23, at 90.9%.
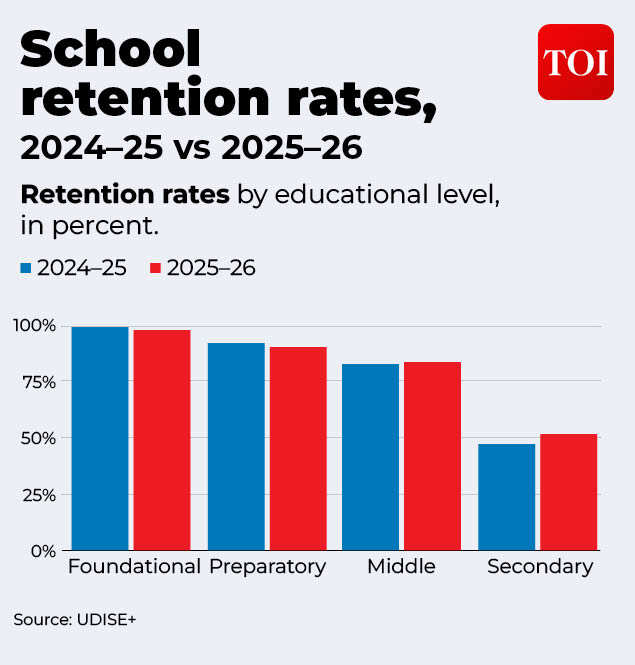
Retention tells a similar mixed story
Enrolment and transition numbers add to the picture. Secondary GER rose from 68.5% to 71.7% this year; across the four-year period it actually dipped to 66.5% in 2023-24 before climbing back and past its 2022-23 level of 67.6%. Middle GER has stayed roughly flat for four years, moving between 89.5% and 90.3% and settling at 89.6% now. Transition rates — the share of students who move on to the next stage rather than leaving school altogether — improved at every checkpoint: Foundational-to-Preparatory transition rose to 99.2% from 98.6%, Preparatory-to-Middle to 93.8% from 92.2%, and Middle-to-Secondary to 88.3% from 86.6%, each figure now at its highest point across the four years tracked.Fewer single-teacher schools, better-equipped classroomsThe growth in teacher numbers has also changed how schools are staffed. Single-teacher schools, where one person handles every grade and subject, fell by about 3% in 2025-26 to 1,00,843, continuing a decline from 1,18,190 in 2022-23 and 1,10,971 the year after. Zero-enrolment schools fell even faster — by around 29% in a single year, from 7,993 to 5,663, though the number had actually risen to 12,954 in 2023-24 before the sharp correction that followed. The report attributes both declines to how UDISE+ data itself is used, allowing planners to reallocate teachers to where enrolment actually needs them, rather than leaving schools overstaffed relative to the students they serve.
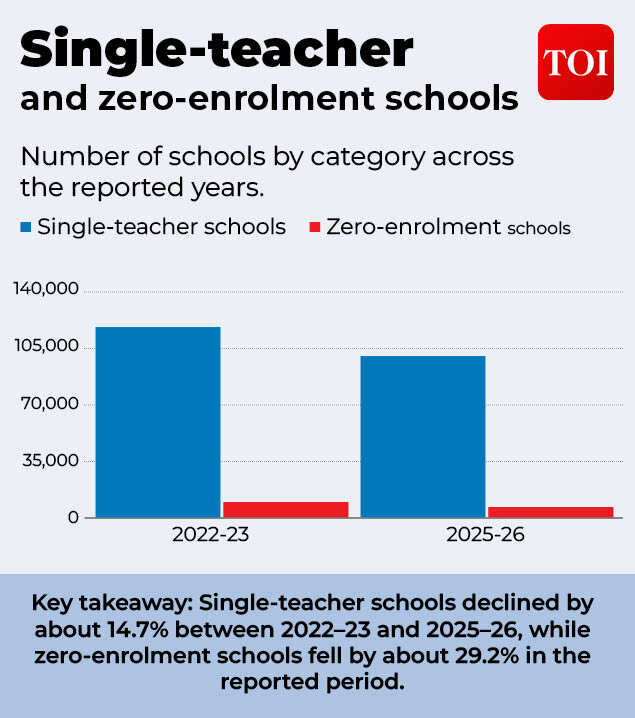
Growth in teacher numbers has also changed how schools are staffed
School infrastructure has improved along with the workforce. Computer access rose from 47.7% in 2022-23 to 69.9% in 2025-26, with the sharpest single-year jump, a 9.5 percentage point rise, coming in 2023-24. Internet access followed a close path, up from 49.7% to 67.4% over the same period. Basic facilities are now close to universal: 95.0% of schools have electricity, up from 91.7%; 99.5% have drinking water; 98.5% have girls’ toilets and 97.2% have boys’ toilets; and 96.9% have handwashing facilities, up from 94.1% four years ago. Library access has also grown steadily, from 88.3% to 90.5% of schools. Two areas lag behind the rest — playgrounds, present in 81.9% of schools, actually declined slightly from 83.0% the previous year, breaking an otherwise uninterrupted rise since 2022-23, and rainwater harvesting remains available in just 29.9% of schools despite steady incremental gains each year since a base of 28.0% in 2022-23. Ramps and handrails for students with disabilities have grown from 51.0% to 58.2% of schools, though more than four in ten schools still lack them.Women now make up most of the teaching workforceThe report also points to a shift in who is doing the teaching. Women now make up 54.9% of India’s teachers, up from 52.3% four years ago and 53.3% the year after that — a steady climb of more than two-and-a-half percentage points across a workforce of over a crore people.
Share your thoughts in the comments
Be respectful · TOI community guidelines
Girls’ enrolment has moved more slowly but just as consistently, from 48.0% in 2022-23 to 48.1%, then 48.3%, and now 48.4% in 2025-26 — small annual shifts that add up to real change in a system enrolling tens of millions of students each year.
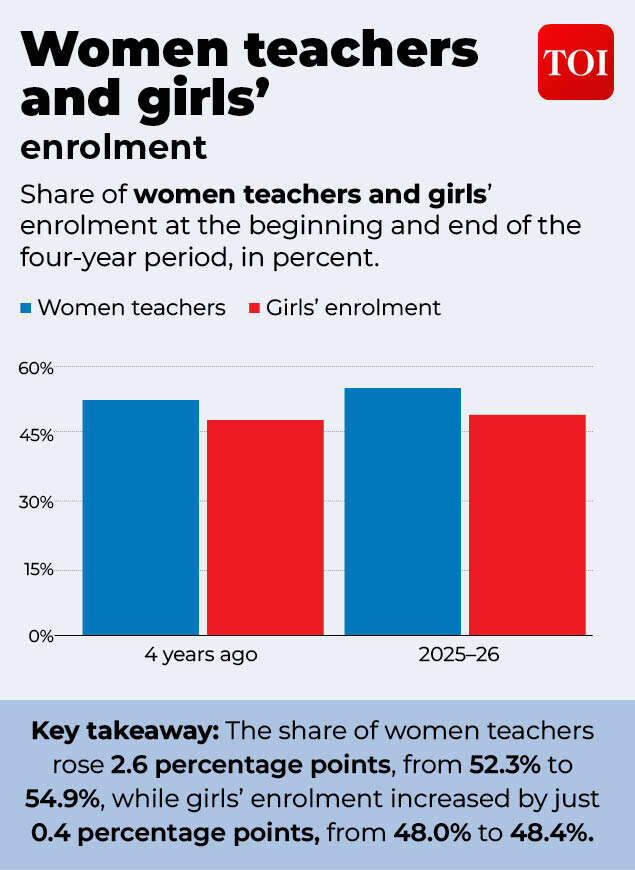
Report also points to a shift in who is doing the teaching
Read together, the UDISE+ 2025-26 numbers show a system that added capacity, tightened ratios and expanded infrastructure over four years, while still carrying a few gaps that didn’t move like the rest of the data — a middle-school dropout rate that rose instead of fell, a Foundational and Preparatory retention dip after years of improvement, a zero-enrolment number that spiked before it fell, and a playground shortfall the other infrastructure numbers don’t quite explain. None of these gaps undoes the larger trend, but they’re the parts of the report worth watching in the years ahead, since they mark the points where the steady four-year climb didn’t hold.